Intro
In this blog, I will show you how to use the Monitoring Tools within Control Centre to analyse user traffic stats as well as how to use WebPageTest to understand the Website performance.
What’s Hot?
Have you checked the previous Your Application at the Edge [S01E03] blog post? It details how to use Ion to deliver the HTML page and other static assets to end-users by enabling the CDN features and capabilities such as caching provided by Akamai.
Context
In the previous blog, I covered the process of integrating a Website or Application into the Akamai Edge Platform. Now, we will focus our attention on understanding the Monitoring Tools and what to look at when analysing website performance using the WebPageTest tool.
Requirements
You should have done all the steps and tasks described in the previous blog post.
Control Centre – Traffic Reports
In the Akamai Portal, you will get access to the Traffic Report. Once you access the Traffic Report you can select the Content Provider Code related to your Akamai Delivery Property. You can also choose the type of traffic, the date range and the aggregation trend.
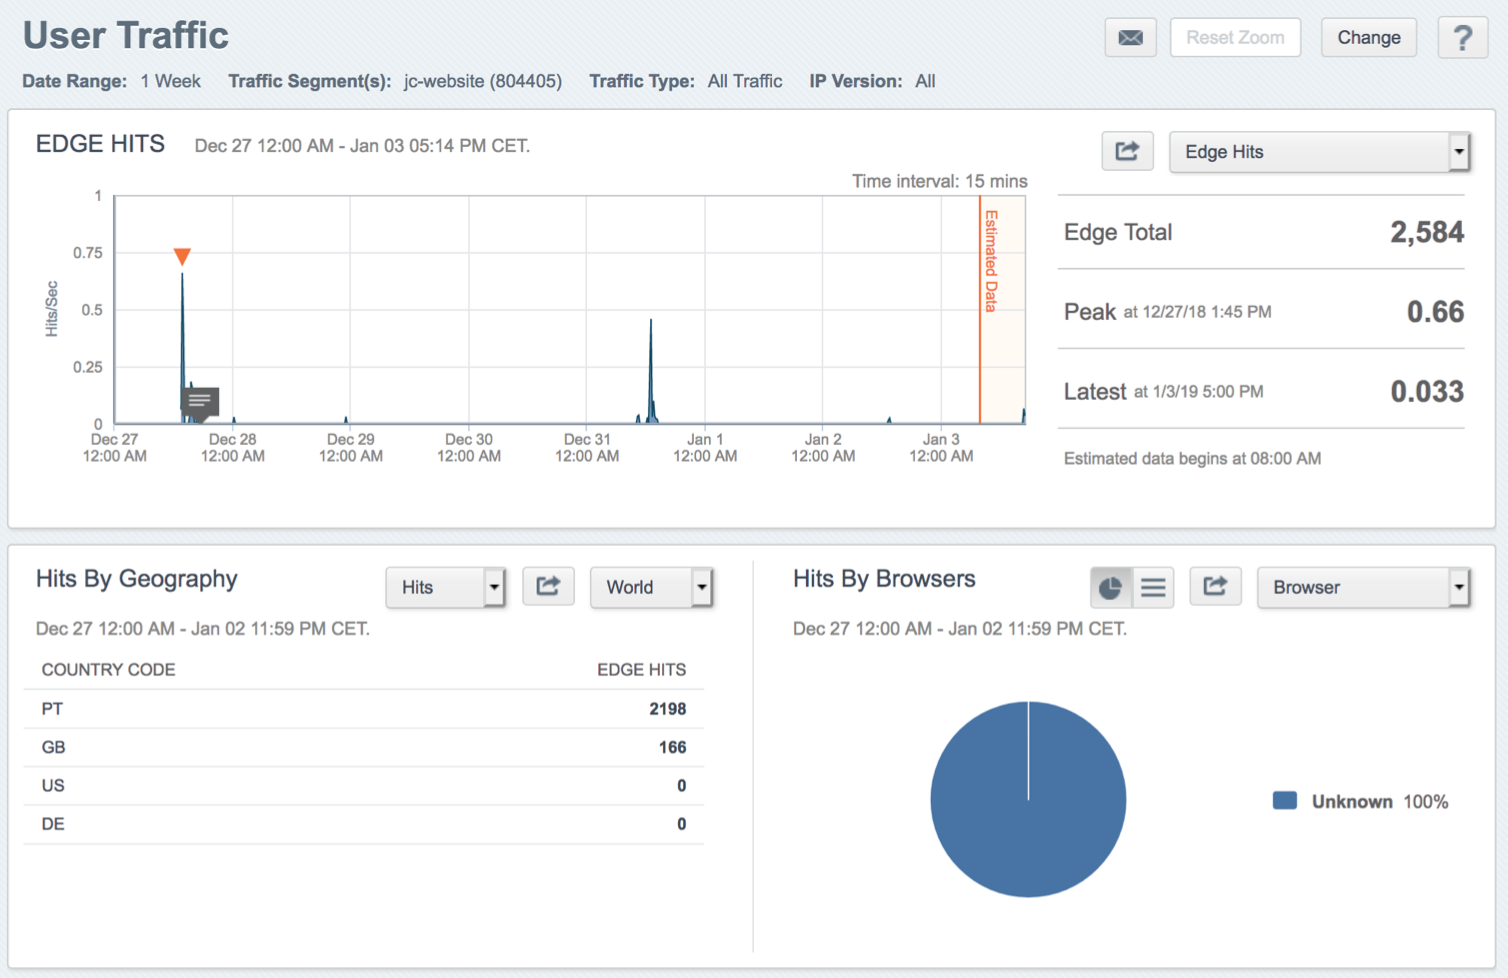
The first graph represents the Edge Hits for the last week. As you can see there were around 2500 Edge hits with a peak of 0.66 hits/sec. Under the User Traffic, you can also see the Hits by Geography. Most of the incoming requests came from Portugal and Great Britain. The same interface provides you with a breakdown of hits by browser type.
 |
|---|
| Figure 1: User Traffic – Edge Hits breakdown. |
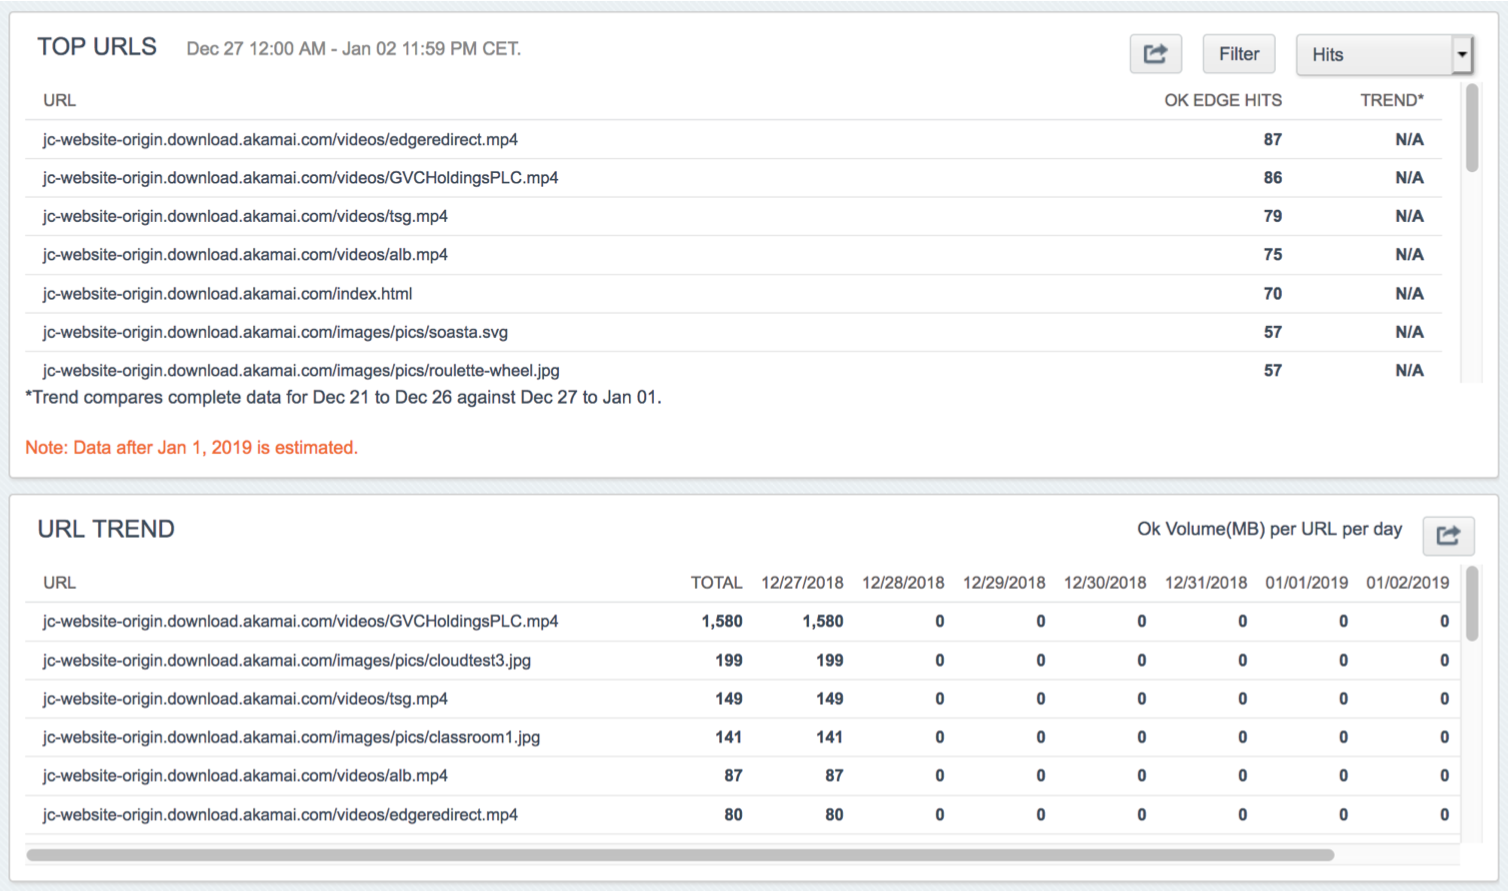
Also, you have access to the Top URLs for that particular period of time.
 |
|---|
| Figure 2: User Traffic – Top URLs. |
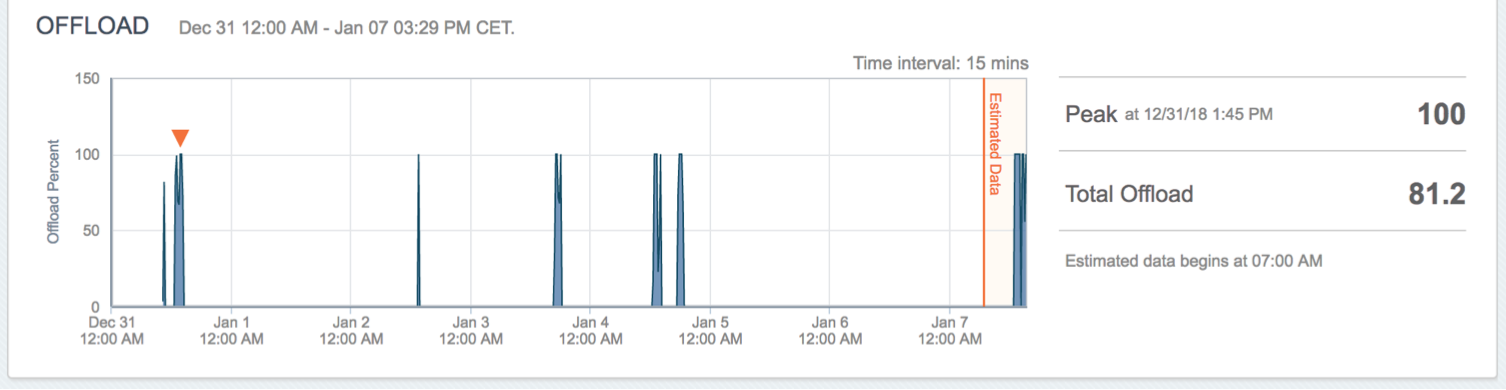
In addition, the Monitor Tool allows you to look at the Offload values. For the http://www.jcnotebook.com/ Website between 31st of December 2018 and 7th of January 2019, the offload was around 81%. It also gives you a breakdown of the top URLs.
 |
|---|
| Figure 3: Offload Dashboard. |
In the next section, we are going to look at the information provided by WebPageTest.
WebPageTest – Performance Results
For the ones who are not familiar with WebPageTest, WebPageTest is an open-source tool that allows you to run a free website speed test from multiple locations around the globe using real browsers (IE and Chrome) and at real consumer connection speeds. You could, for example, run simple tests or perform advanced testing including multi-step transactions, video capture, content blocking and much more. The results will be provided in a form of diagnostic information reports including resource loading waterfall charts, content breakdown, performance metrics and others.
I ran a test against www.jcnotebook.com/index.html from London using a cable connection (5/1 Mbps 28 ms RTT). Because the Website domain name is not registered, I used the host resolve option with the following rule: *MAP .jcnotebook.com 88.221.208.111. That means all the jcnotebook.com hostnames will be mapped to the Akamai Production IP Address 88.221.208.111.
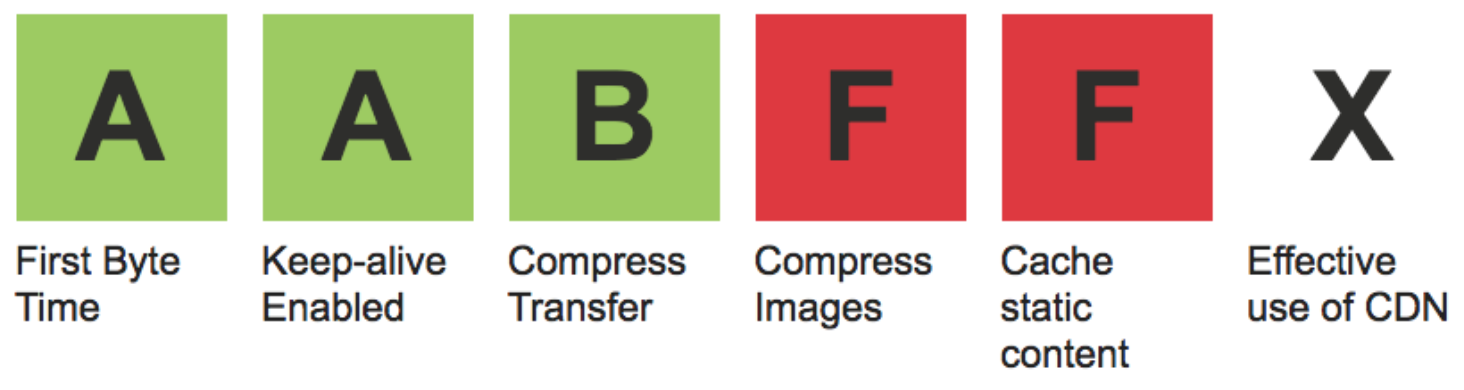
The first thing to look at is the classification on the top left-hand. They provide a qualitative idea of some of the website performance parameters such as First Byte Time, Keep-alive Enablement, Compression, Caching and Effective use of CDN.
 |
|---|
| Figure 4: WebPageTest – Qualitative results. |
Looking at the results, you see that I’ve got an A for First Byte Time and Keep- alive Enabled, a B for Compress Transfer, an F for Compress Images and Cache Static Content and an X for Effective use of CDN. Those results are as expected because:
- I am delivering the pristine images and I am not using any compression algorithm or feature to reduce their size consequently, I am not saving any bytes.
- WebPageTest uses the “Expire” and “Cache-Control: max-age” to analyse the browser caching settings of static content. If the expiration is set for less than 7 days you will get a warning. If the expiration is set for less than 1 hour you will get a failure. Although all the static objects are being cached at the Edge and in the Browser cache, WebPageTest gives me a “Warning” and “Failed” for some of the static assets because they are below the thresholds defined by the WebPageTest.
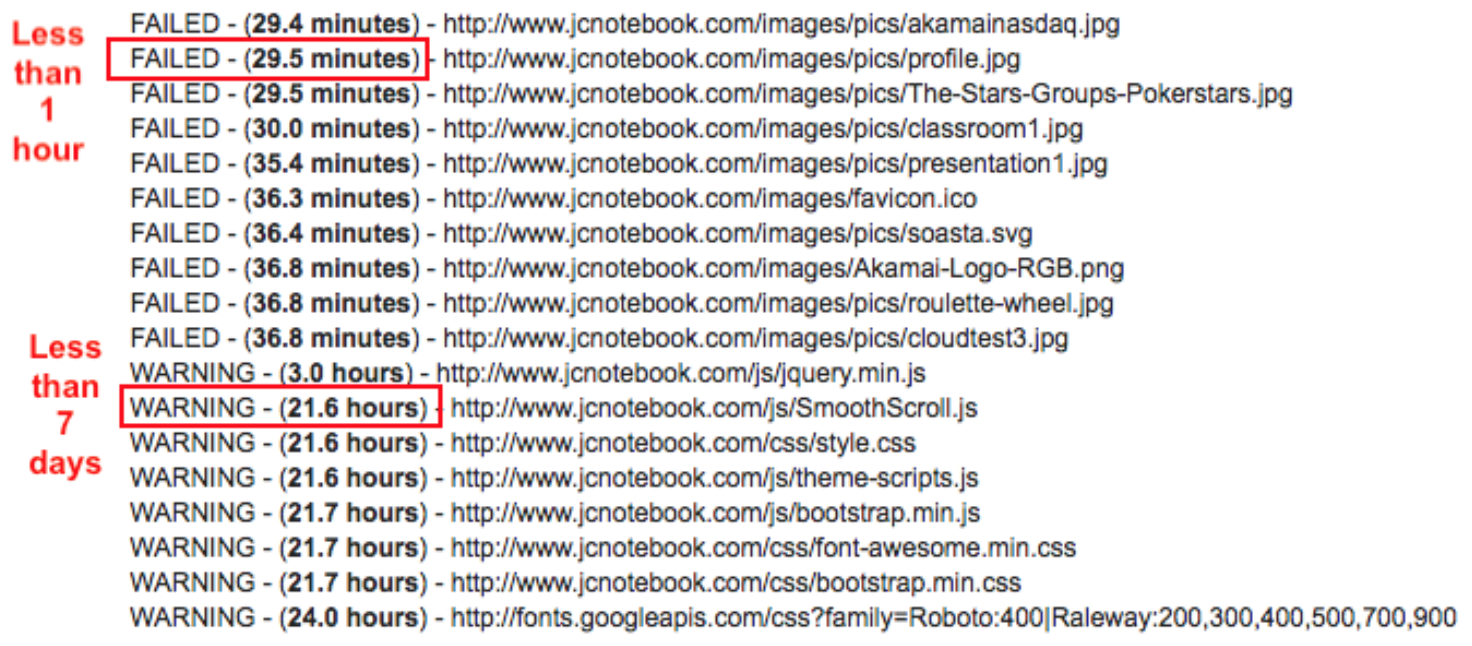 |
|---|
| Figure 5: Leveraging Browser Caching of Static Objects. |
- WebPageTest also tells me that www.jcnotebook.com is not effectively using a CDN network. That’s not true. WebPageTest looks at the CNAME chain and checks if the domains are mapped to a known CDN network. Because the Website hasn’t been registered, I had to map the domain directly to the IP address provided by the Akamai CDN Platform. That’s the reason why WebPageTest thinks jcnotebook.com is not using a CDN network.
Those are things we can change and improve. For example, we could use Akamai’s Image Manager to reduce the number of bytes while maintaining the visual quality of the images. We could increase the TTL of the Downstream Cacheability Settings under the Akamai Property and also register the Website.
But we leave that for later as the focus of this article is to understand what to use and where to look when you want to analyse your Website/Application performance.
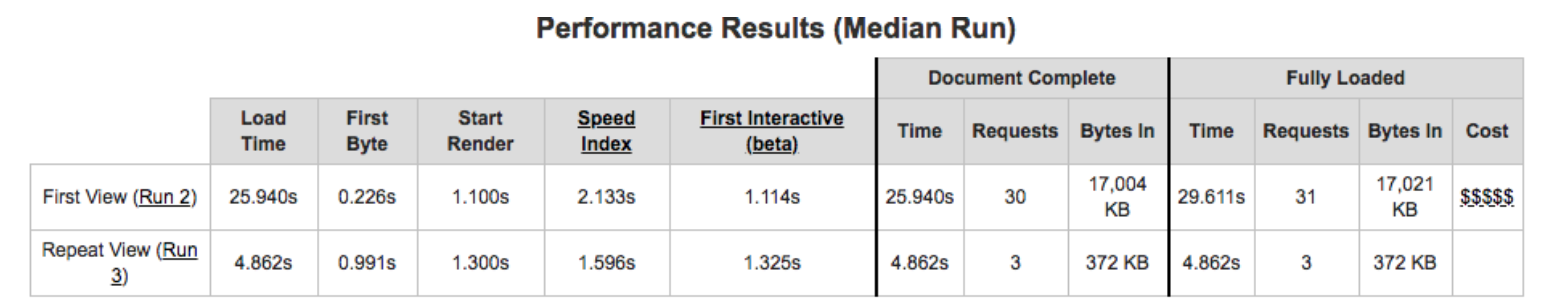
Looking at Figure 6 which shows other performance metrics, we can see that the Website takes 29.6s to be fully loaded which is a huge value when looking at the market recommendations and what customers are looking to achieve. The page wights around 16.6MB which once again, when compared to other websites, let’s take the example of Amazon.co.uk which weighs around 6.4MB, 16.6MB is a big number.
 |
|---|
| Figure 6: Performance Results. |
WebPageTest provides you with resource-loading waterfall charts where you can dig down to understand the details of each request and asset and the way your Webpage behaves when loading the content.
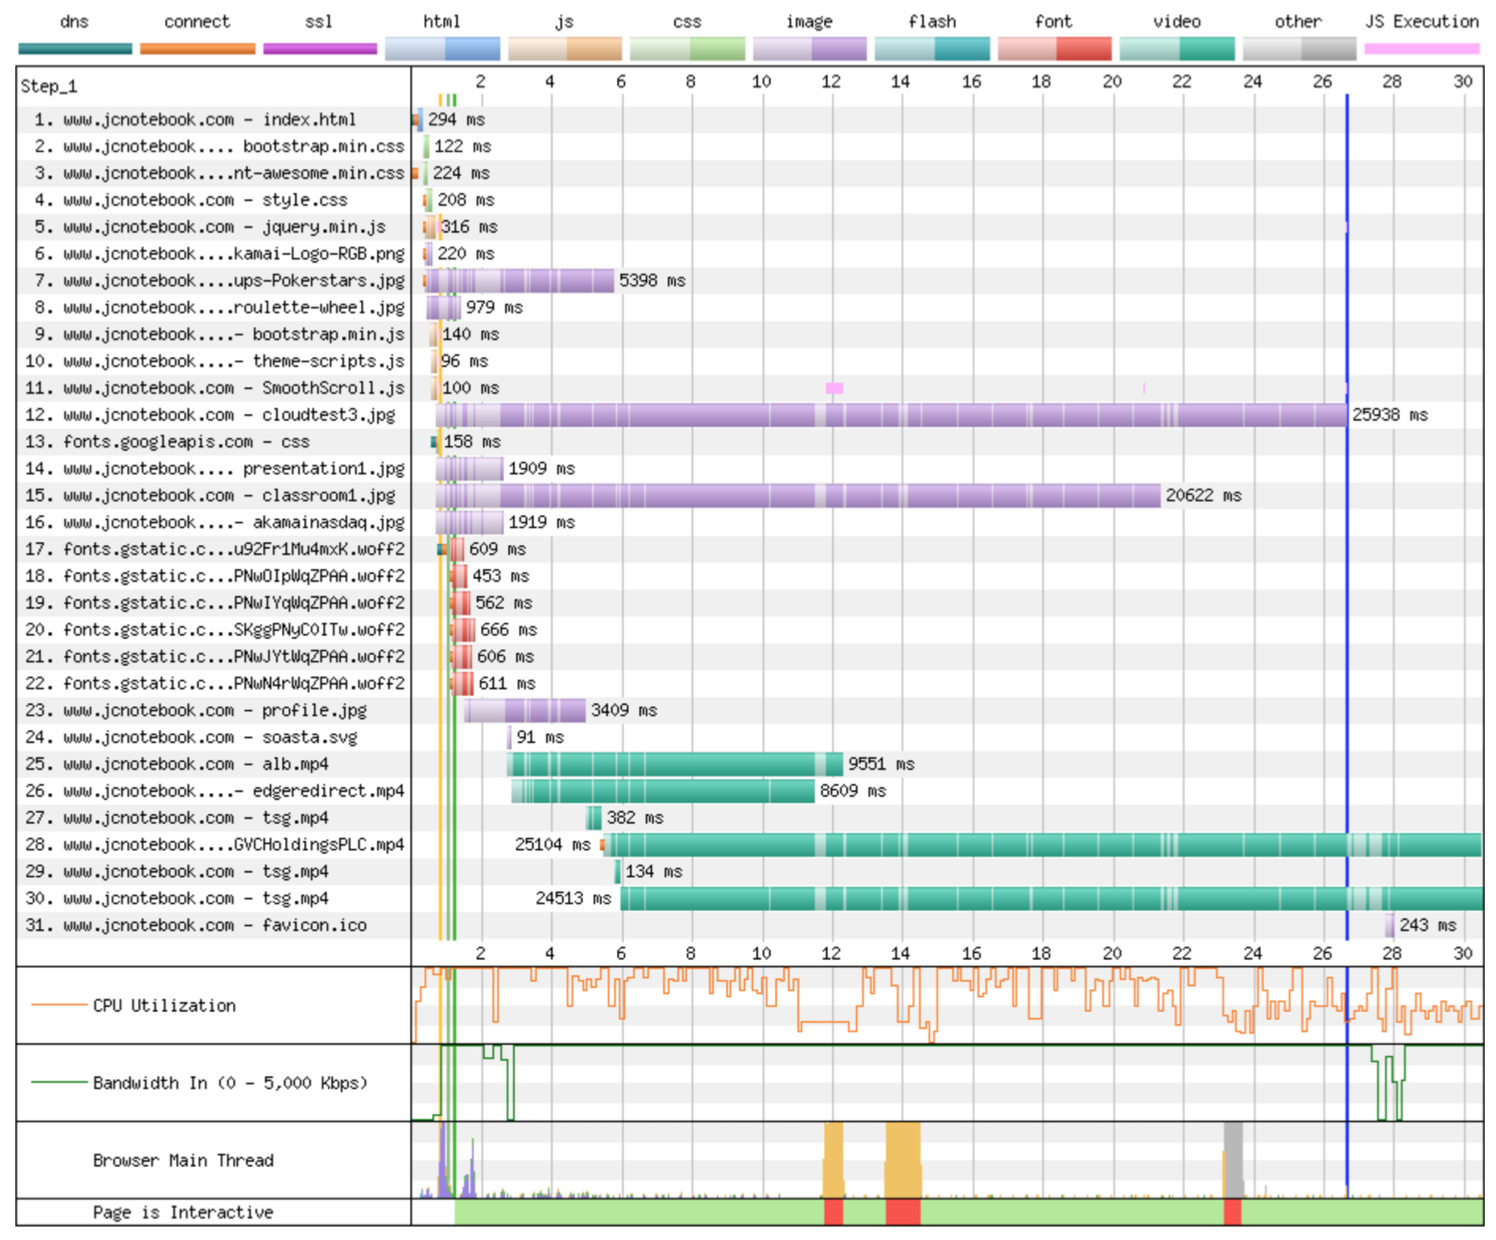 |
|---|
| Figure 7: Loading Waterfall Chart for www.jcnotebook.com/index.html. |
As you can see from Figure 7 above, there are some images and videos that take a long time to download.
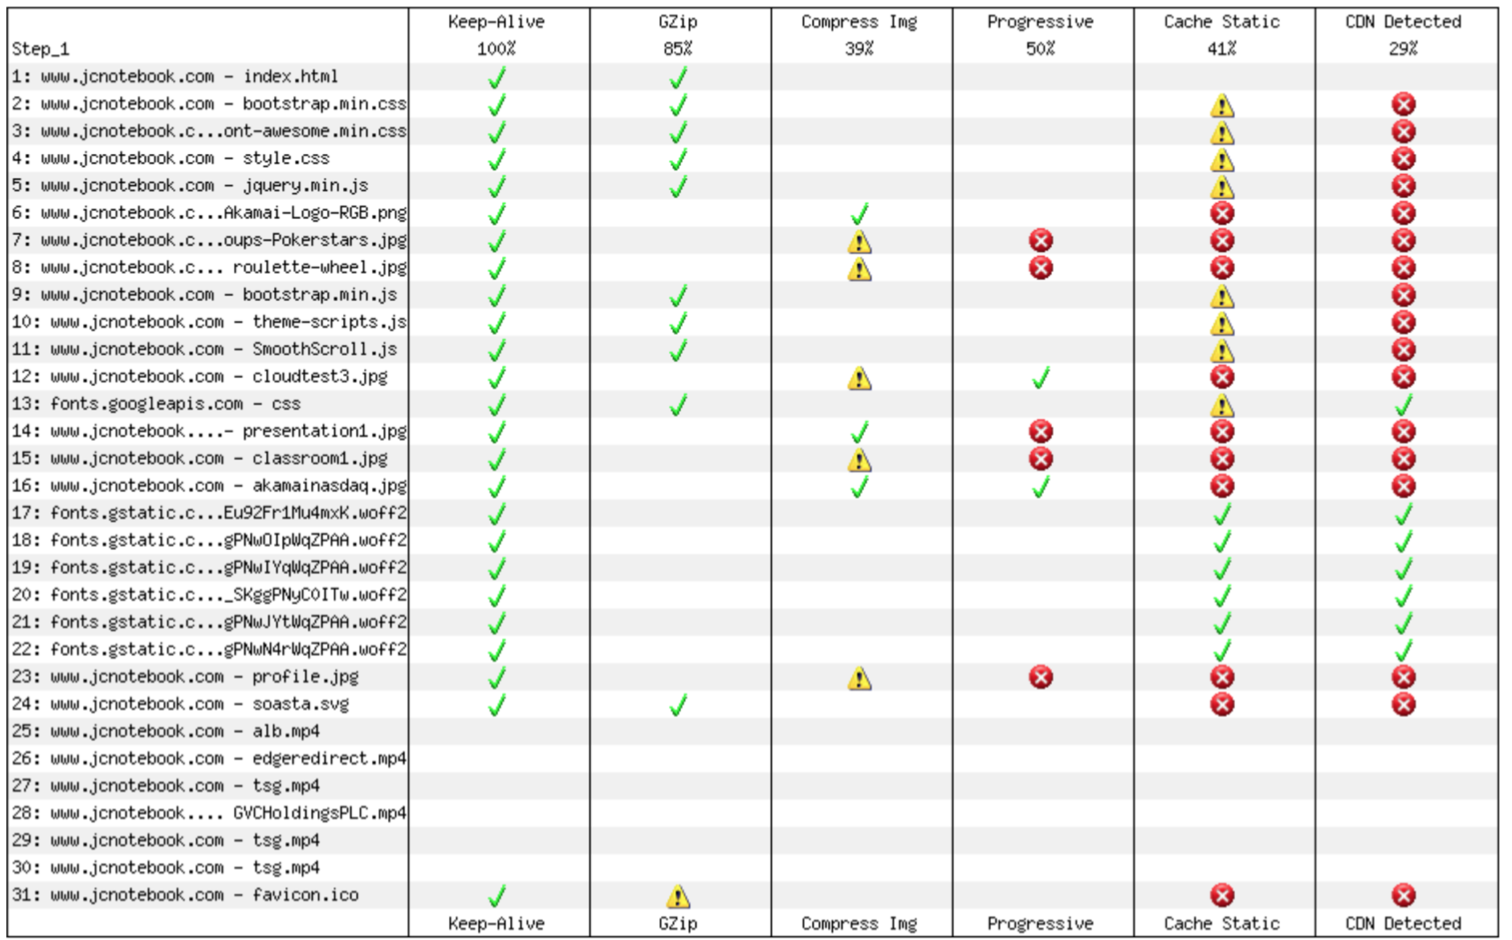
Looking at the Performance Review tab we can see the full list of assets and the things we could still do to optimise the Website further. There is room for improvement mainly around compressing images, using progressive JPEGs and caching static content for longer. These points for improvement will be addressed in the future.
 |
|---|
| Figure 8: Performance Review. |
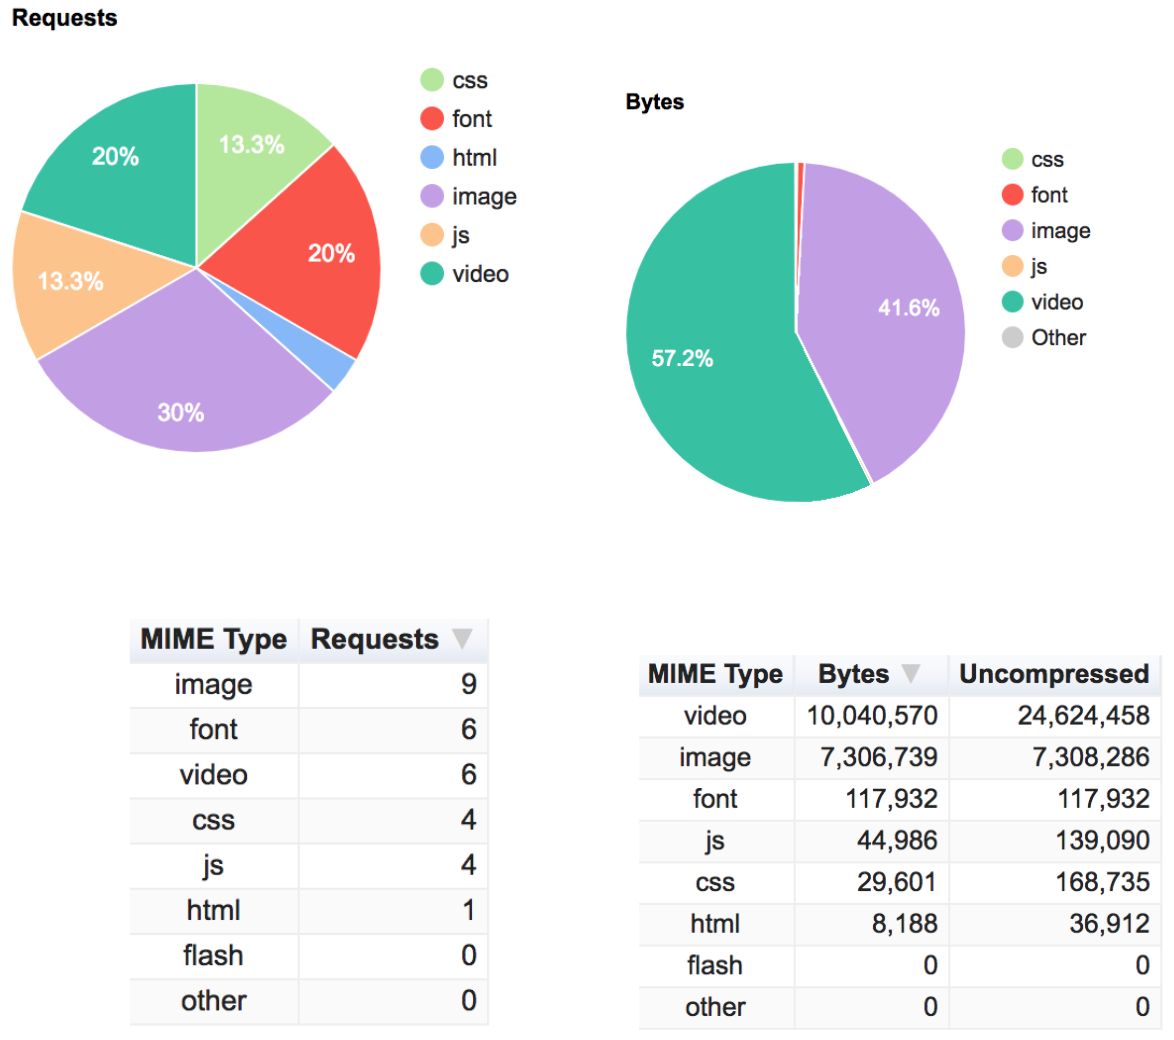
WebPageTest also provides you with a breakdown of the content type. If you look at Figure 9, we will see that 57.2% of the page size is video and 41.6% are images. So, the below picture tells us if we want to reduce the number of bytes we should start optimising the videos because they contribute to more than half of the page size. Then, we should optimise the images and they are the second largest piece of the pie. Note: In order to reduce these percentages we could use the techniques described above. In terms of the number of requests, the Website has a fair distribution but that depends on what type of content it has.
 |
|---|
| Figure 9: Content Breakdown by MIME Type. |
There are a lot of other options and details for analysing and interpreting the results from the Webpage test. But the ones shown above are in general the most commonly used.
Summary
The Monitoring Tool is a good way to analyse the Website traffic over the CDN infrastructure. It provides you with a view of the number of Edge Hits, Offload values and Top URLs as well as location and browser information.
The WebPageTest is a great tool to asses the WebSite Performance giving you hints on what you could do to improve the Website performance.
When combining both tools you have a good baseline to work with. It will give you the visibility you need to improve and optimise your Website.
Alternatively, you could use other synthetic testing tools like CloudTest from Akamai, or real user data from mPulse to better understand the end-user journey through the website.
What’s next?
The next blog post will cover how to configure DataStream and how to use it to gather real-time information on CDN health, usage, errors, events and origin response times for www.jcnotebook.com and later we will focus on improving video and image delivery using Akamai Image Manager 4.0.